Basic of Chart Reading and Candlesticks
What is a Chart?
A chart is a historical representation of data in which data is represented in various ways. Data representation can vary with different time frames. There are many ways of data representation, you can represent the same data using a line or a chart or pie chart anyone that you like and understands better.
What is Timeframe In trading?
Data is represented in multiple periods of time. The majority of platform give time frame starts from 1sec to 1 month for premium members, for a free user, it’s from 1 min to 1 month.
There are different types of traders in every market like short term, midterm, and long term traders. The short-term traders mostly use 5 min to 1-hour timeframe charts for trading. The midterm traders use 4-hour to 1-day timeframe charts for trading. The long-term traders use mostly weekly and monthly timeframe charts for trading.
Now let us understand some important terms in trading:
What did the term define bullish and bearish in the market?
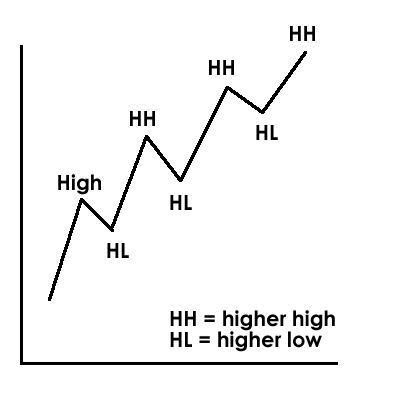
The bullish word itself gives a meaning aggressive, and although in the financial market this term used refers to market sentiment when a security price is in an uptrend (makes higher and high).
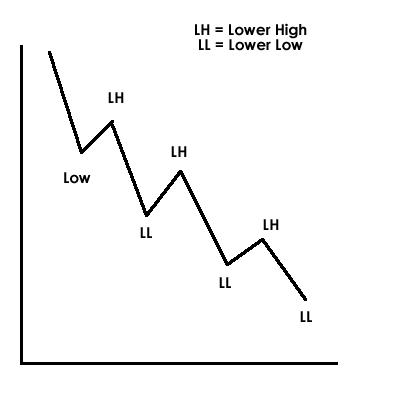
Bearish when a security price is in a downtrend (makes lower low).
What is higher high (HH), higher low (HL), lower high (LH) and lower low (LL)?
We all know when the market is trending it neither moves straight up or down unless there is a piece of fundamental news released. When the security is bullish it moves to make Higher High (HH) and Higher Low (HL). In a nutshell, when prices move upwards and it makes a correction slightly lower and makes a new higher high (HH).
Same as it is, when the security is bearish it moves Lower low (LL) and Lower High (LH). We can say that price moves downwards and make a slightly high move and follows the major trend of lower low (LL).
Now let’s talk about some popular various types of charts used in trading.
Types of charts
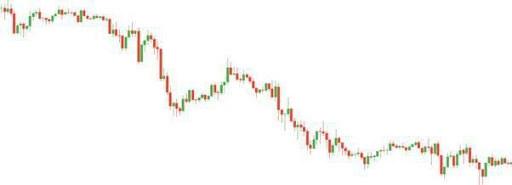
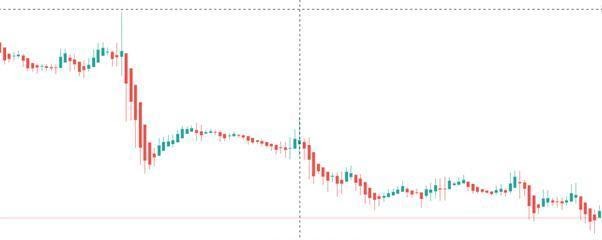
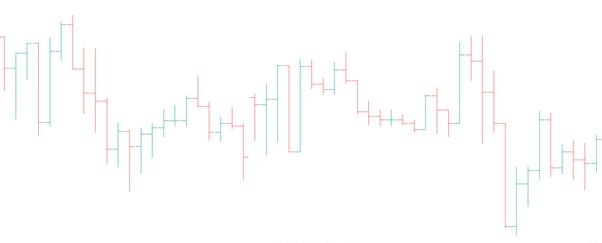
Candlestick Chart
This chart is the most popular and widely used for trading. Each and every platform have this candlestick chart. This candlestick was developed by a Japanese rice merchant in the late 1700s to track the price action of rice futures. Often this candlestick is also called “Japanese Candlestick”. This candlestick consists of four prices. Prices indicate open, high, low, and close (OHLC).
Heikin Ashi (HA)
Heikin Ashi candlesticks if a side branch of Japanese candlestick. It uses the data of Japanese candlestick (i.e., OHLC) and used to plot Heikin Ashi candles.
Heikin Ashi candlestick calculation:
Open = (open of previous bar + close of previous bar)/2.
Close = (open + high + low + close)/4.
High = the maximum value from the high, open, or close of the current period. Low = the minimum value from the low, open, or close of the current period
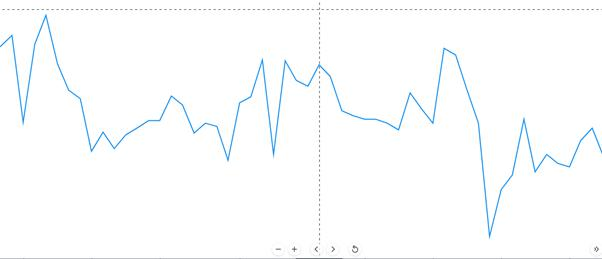
Line Chart:
A Line chart is the easiest and the simplest trading chart in trading. This chart is plotted by the close price of the security under a given timeframe. This chart is quite easy to trade, but have some limitation because it not provides proper data for traders who have a strategy based upon price and or something like that.
Bar Chart:
A bar chart consists of OHLC price and a stick which has a small stick on the left and right on that stick which indicates open and close price respectively.
Note: There are more different trading charts like Renko, Kagi, Line Break, Point & Figure, etc. but not used quite often. So, it’s better to use a popular and better one available.
History of candlestick
In the early around 17th century, it was first used by rice traders for understanding the fluctuation of price. A person from the US named Steve Nison used this technique to understand Dow Jones and NYSE after 1850 and published his book “Japanese Candlestick Chart Techniques”. Munehisa Homma was the farmer who developed.
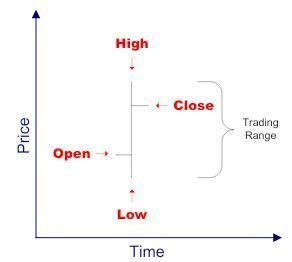
What is Candlestick?
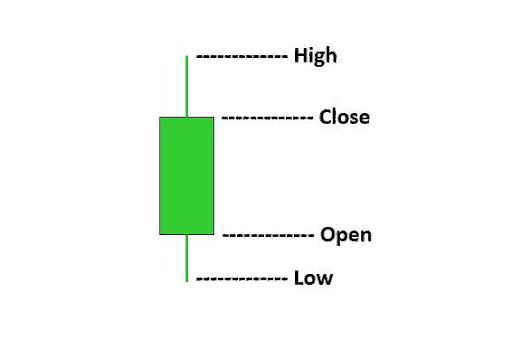
A candlestick is a visual representation of price, specifically to display Open, High, Low, and Close (OHLC). A candlestick has 4 prices I.e., OHLC prices, which is used to form bars/body of the candlestick. A candlestick is also like a
bar chart but has a body between open and close price. A candlestick can be green or red depending on opening and closing price or more specifically it can be bullish or bearish.
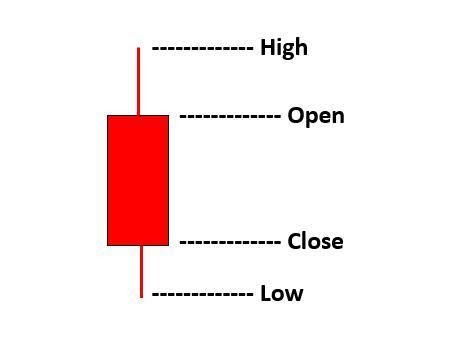
So, what does bullish and bearish candlestick means?
When the closing price is greater than the opening price then it should be considered as bullish candlestick and when the open price is less than the closing price then it’s a bearish candlestick. The below Image will make you clearly understand.
Candlesticks can be of various types
Let’s have some basic knowledge of candlestick patterns.
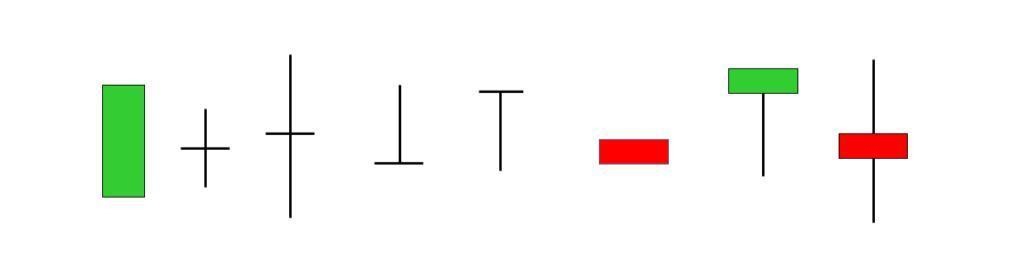
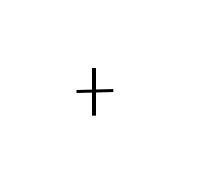
What is a Doji?
A Doji is a price reversal candlestick that have the same opening and closing. This candle signifies indecision in the market between buyers and sellers. This candle mostly forms at the end of the downtrend or uptrend and looks like a plus sign. It has small decent wicks with the same open and closing price or negligible body. There are different types of Doji.
Standard Doji
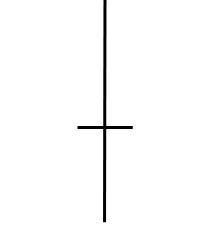
Long Legged Doji:
It’s a candle that looks the same as Doji but has much longer wicks (shadows) than Doji. Mostly appears in a trend indicates strong indecision.
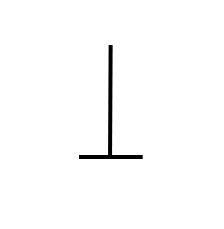
Gravestone Doji:
This Doji indicates that neither buyers nor sellers are active and it’s a bearish reversal candlestick. Between the opening and closing of this candle, buyers pushed the market upside but afterward seller take over the market and closed at the same opening. This type of Doji often found at the uptrend, usually nearby resistance indicating selling pressure.
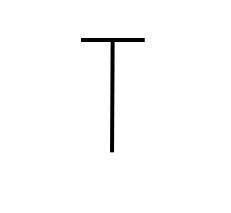
Dragonfly Doji:
This type of Doji is a bullish reversal candlestick where sellers push the market downside but buyers take over the market and closed at the same opening price. This type of Doji often found at a downtrend, usually at the support level of the market indicating buying pressure.
We will continue to post technical and informative articles for our readers. Keep Learning, Keep Earning 🙂
About the Author
Guruprasad Venkatesha is Co-Founder & CEO of b-cube.ai, a French-Hungarian startup making trading in cryptocurrencies easier & more profitable using AI/ML and complex mathematical models. He started his first asset management company when he was 16 years old and had a successful exit later. Then he went on to work for Morgan Stanley as an Investment analyst then he quit the job to jump into the world of Cryptocurrencies.
You can follow him on the following social media channels:
LinkedIn: https://www.linkedin.com/in/guruprasadvenkatesha/
Twitter: https://twitter.com/GuruprasadVenk1
B-cube.ai Telegram community Link: https://t.me/bcubeaichat
— The information provided on this website does not constitute investment advice, financial advice, trading advice, or any other sort of advice and you should not treat any of the article’s content as such. Author, website or the company associated with them does not recommend that any cryptocurrency should be bought, sold, or held by you. Do conduct your own due diligence and consult your financial advisor before making any investment decisions.—
Költs kriptóból közvetlenül a Kraken Krak Mastercarddal!
MI A TEENDŐD?- Regisztrálj a Krakenre a linkünkkel.
- Igényeld meg ingyenesen a Krak Cardot.
- Add hozzá Apple Payhez vagy Google Payhez.
- Vásárolj közvetlenül Kraken egyenlegedről akár 400+ kripto- és fiat eszközzel.
- Élvezd a 2% cashback-et a vásárlások után, havi vagy éves kártyadíj nélkül!