Guide on Trading Indicators

What are Moving Averages (MA)?
Moving Average (MA) is a very simple and famous indicator used by the majority of the traders in their Technical Analysis. MA (Moving Average) uses the previous price data and average/ smooth out the price, an average is calculated over a specific period of time. Some traders use MA (Moving Average) to find trend direction and some for entry and exits because it cuts the noise from the market and smoothest out the price to understand the trend. There are various types of Moving Average:
Simple Moving Average (SMA)
SMA stands for the Simple Moving Average known as Moving Average in general which just calculates an average of the price over the given period.
Calculation
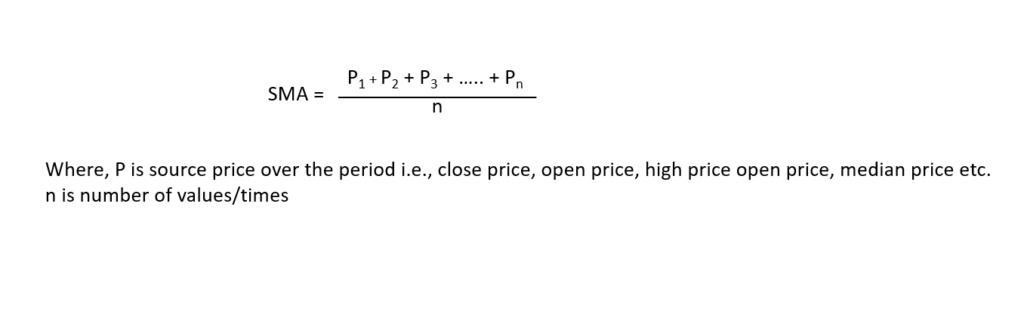
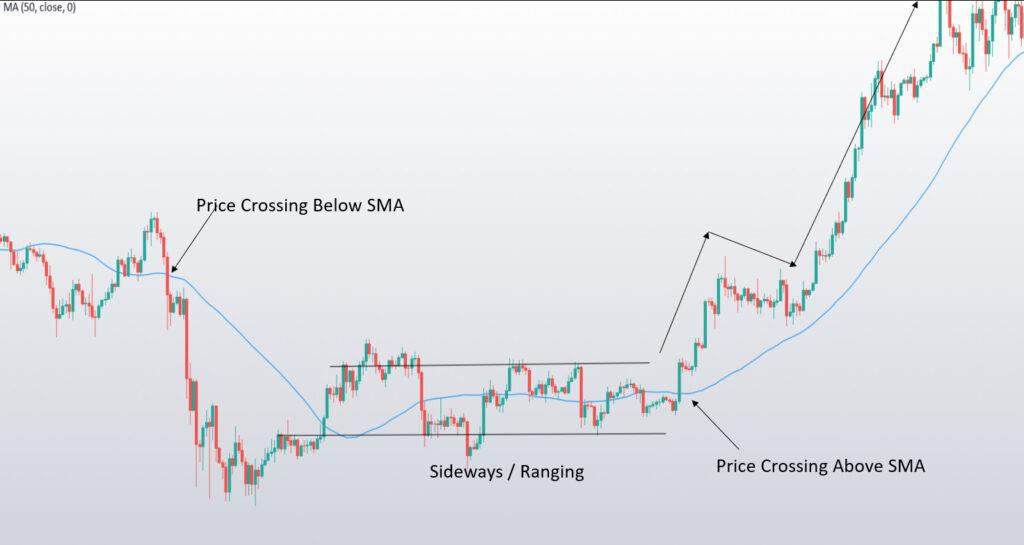
You can use SMA (Simple Moving Average) to find trends. Most use any combination of moving average, which suits you. Most traders use 50 or 100 or 200-period moving average on 4H and 1D TF (Time Frame) for trend direction. Few traders use Moving Average crossovers to enter and exit the trade and price often bounces from MA (Moving Average) line.
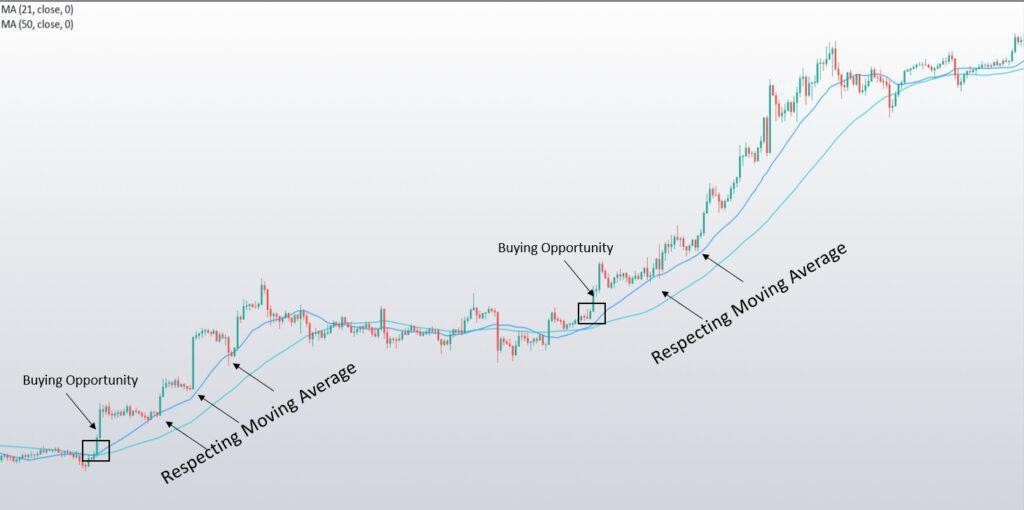
As you see it’s an uptrend and knowing the bigger TF (Time Frame) trend and entry/exits in smaller TF will have some good traders. Often traders use to catch swings using things. Also, if you missed any trade then you can enter while the price is bouncing/ respecting with an MA (Moving Average).
Exponential Moving Average (EMA)
Exponential Moving Average (EMA) is widely used by the trader and better than SMA (Simple Moving Average) because it gives more weightage to recent price by using the most recent data of price. The calculation is a little bit different in it.
Calculation
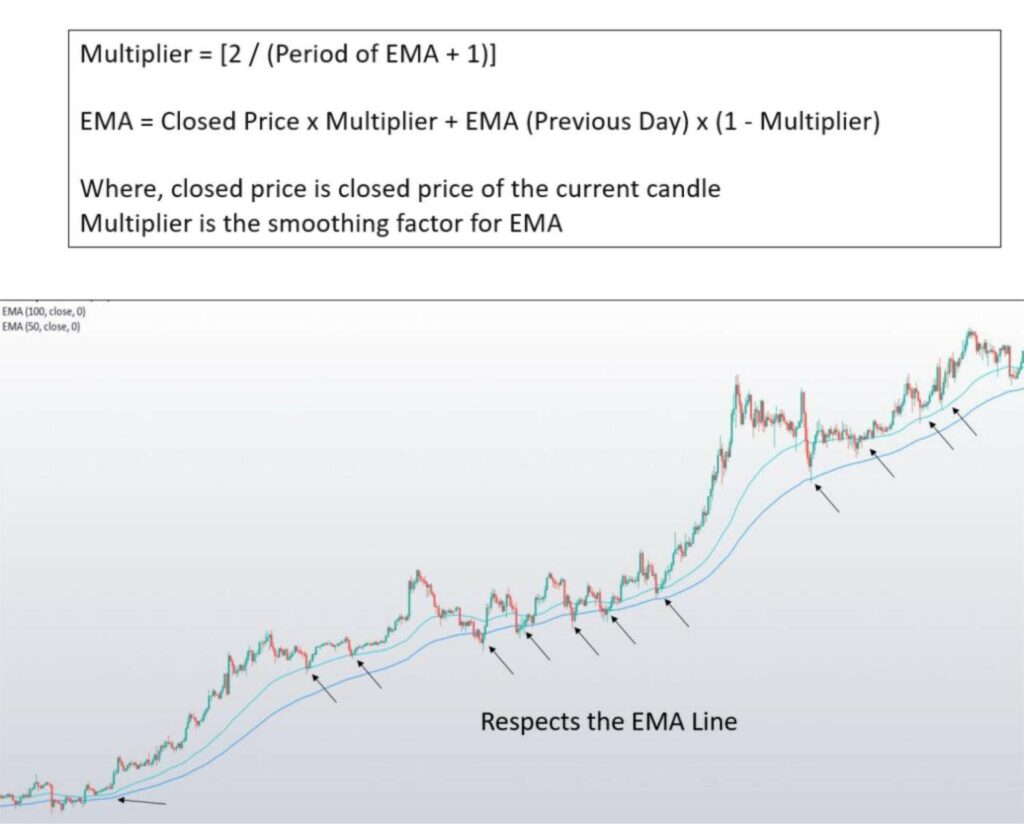
EMA (Exponential Moving Average) is giving much more entries than SMA (Simple Moving Average), if we the trend direction we can catch much more swings. You can use crossover too.
Smoothed Moving Average (SMMA)
Smoothed Moving Average is just an addition of EMA (Exponential Moving Average) and SMA (Simple Moving Average). It gives equal weightage to the current price as the previous prices and takes all available price data into account.
Calculation
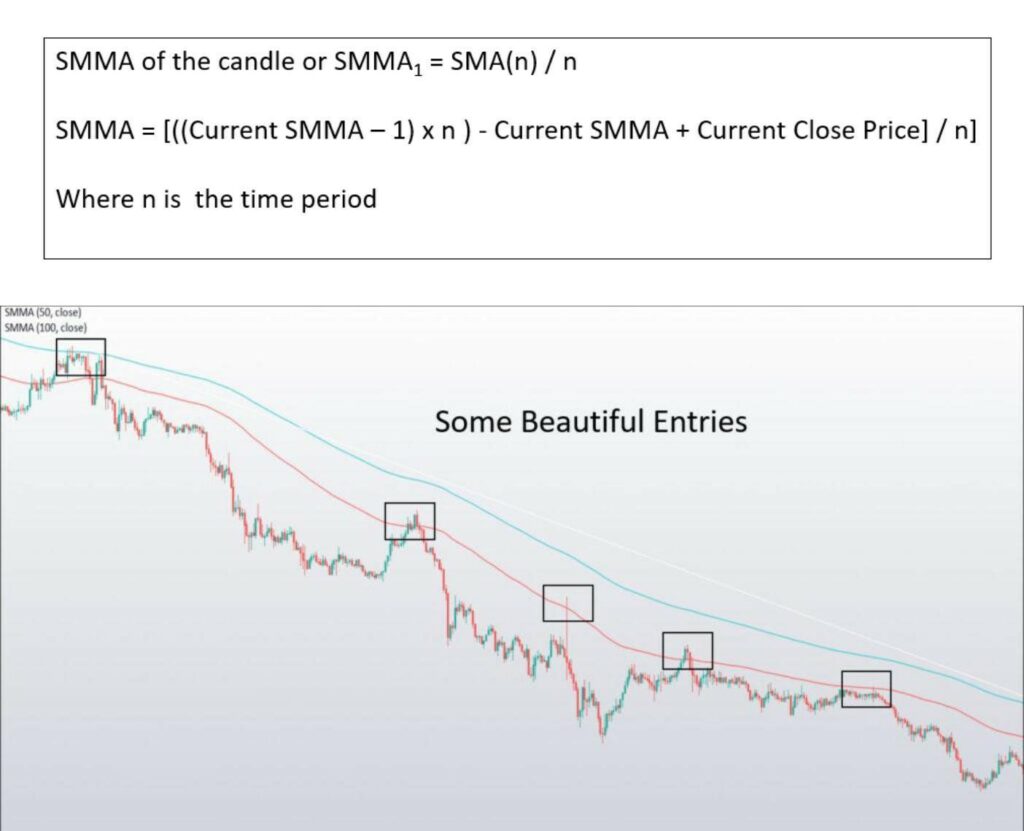
You can also use a combination of SMMA, EMA, and SMA to build a perfect strategy. Although Moving Average is a lagging Indicator is based on the last price, but we can use it as potential entries.
There are many more Moving Averages but not widely used, i.e., LWMA (Linearly Weighted Moving Average), VWMA (Volume-weighted Moving Average), HMA (Hull Moving Average), VMA (Variable Moving Average), etc.
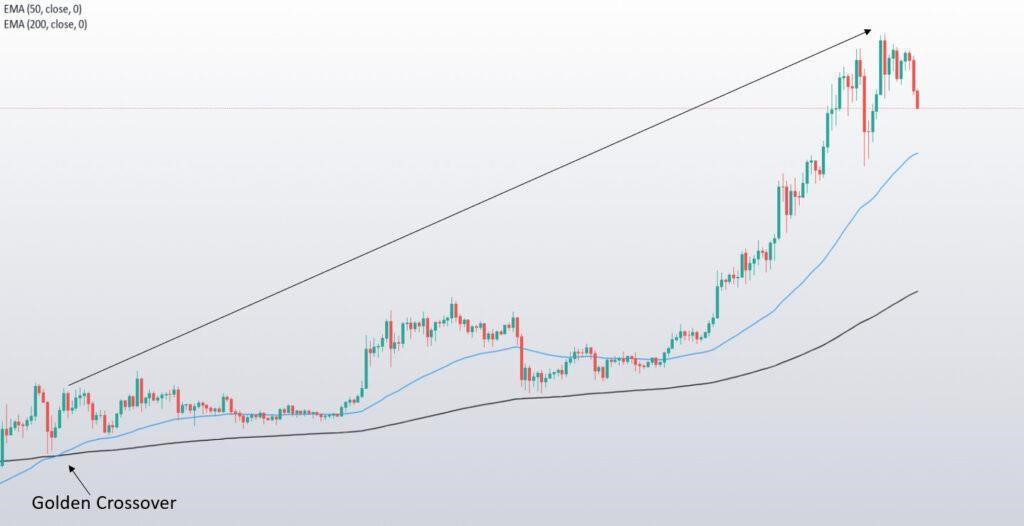
Golden Crossover
When a short period MA (Moving Average, can be SMA or EMA) breaks above, then a longer period Moving Average is known as Golden Crossover. Traders usually see it as a long-term uptrend. Moving Average can be 50, 100 or 100, 200 or 50, 200.
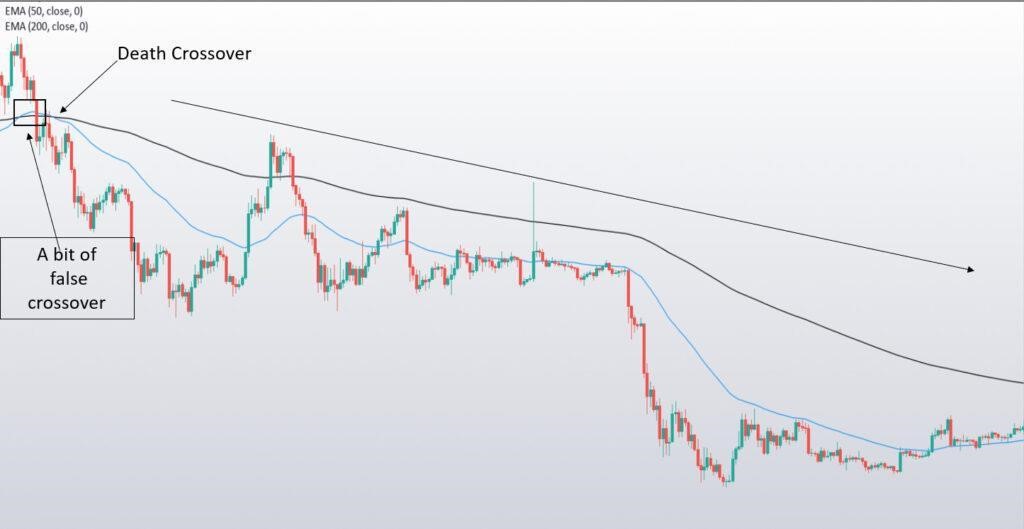
Death Crossover
It’s just the opposite of Golden Crossover, it gives an indication of a potential long-term downtrend. Values are the same as Golden crossover has. False crossover may come because the indicator is lagging.
Note: Always Trade indicators wisely with proper risk management else your trading funds will always at high risk.
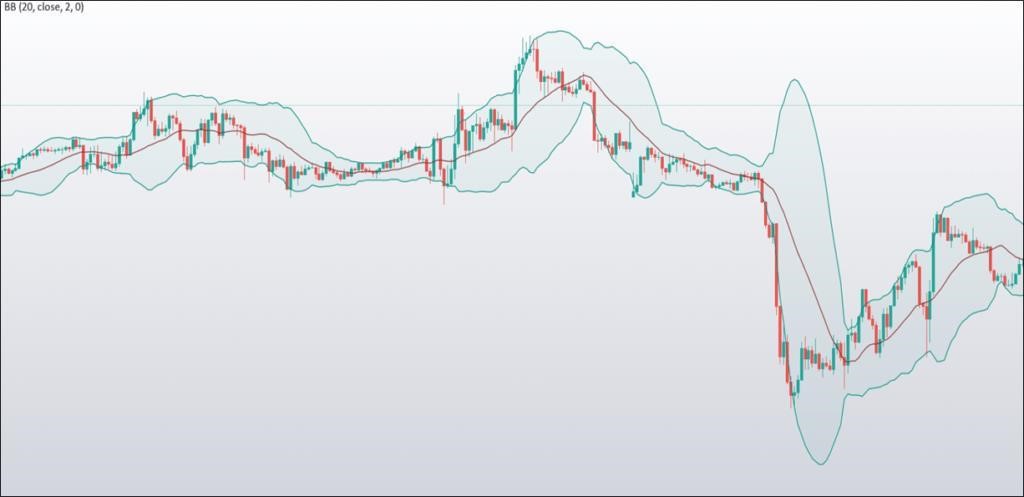
What is the Bollinger Band?
Bollinger Band is a volatility band that is based on the standard deviation. The band expands or deflate with the increases and decreases in volatility. Price is wrapped with 3 SMA (Simple Moving Averages), usually known as Upper Band, Lower Band, and Middle Band. Traders use their own trade style to trade with this. Default BB (Bollinger Band) value of an indicator in 20.
Calculation
Assuming, the default value is 20
Upper Band = 20 Period SMA (Simple Moving Average) + (Previous 20 Standard Deviation * 2)
Lower Band = 20 Period SMA (Simple Moving Average) – (Previous 20 Standard Deviation * 2)
Middle Band = 20 Period SMA (Simple Moving Average)
What is Parabolic SAR?
Traders use parabolic SAR to find the change in the direction of price. The SAR in Word Parabolic SAR is known as “Stop and Reversal”. It’s a non-repaint and lagging indicator.
Calculation
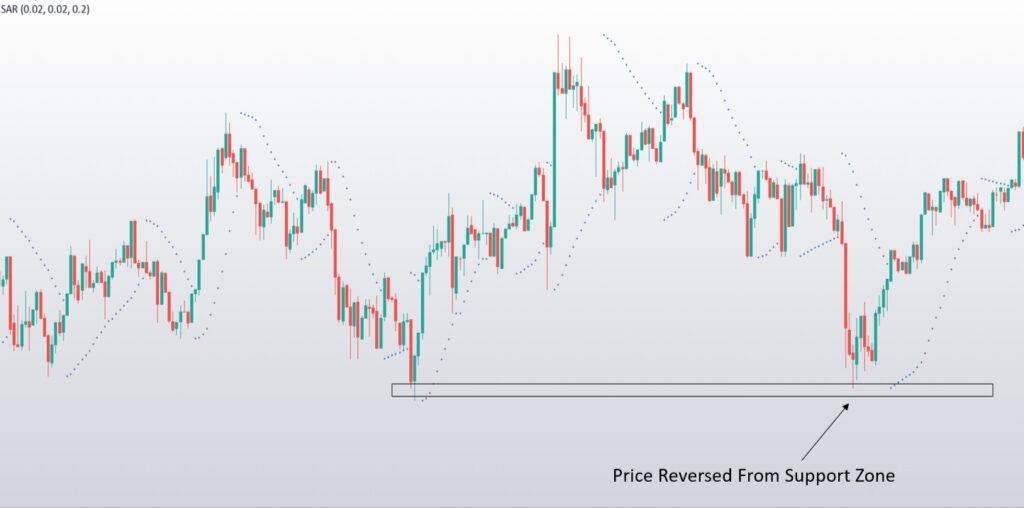
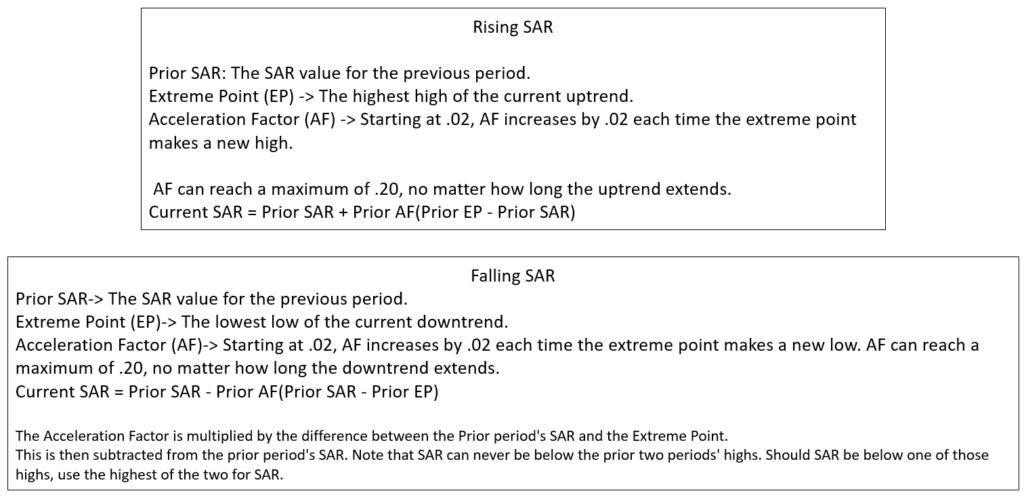
Use this at support and resistance to confirm reversals.
What is Fibonacci Retracement?
Fibonacci Retracement is a popular tool among Technical Traders. Traders use this tool to find potential reversal points. These Retracements are based on ratios of real Fibonacci Series i.e., 0.236 (23.6%), 0.382 (38.2%), 0.618 (61.8%) etc. Some traders often use 0.5 (50%) retracement also. 0.618 or 61.8% is also called the golden ratio. A golden ratio is to be called when diving one number to another preceding number gives a ratio of 0.618 or 61.8% and doing vice-versa gives 0.382 or 38.2% like diving 21 by 34 gives 0.6176 (0.618 round off) or diving 55 by 144
0.3819 (0.382 round off).
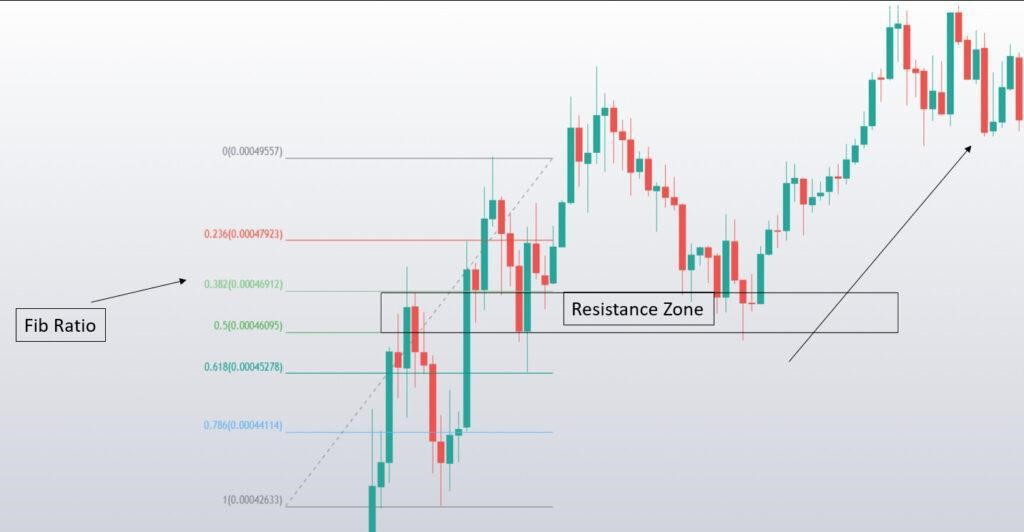
How to draw Fibonacci Levels
On 1st you have to find a strong trend to be biased in a particular direction. Now analyze the same trend in lower TF (Time Frame) in such case our trend is down so we will draw from Lower High to low and mark up the potential continuation zones matching with Fibonacci lines.
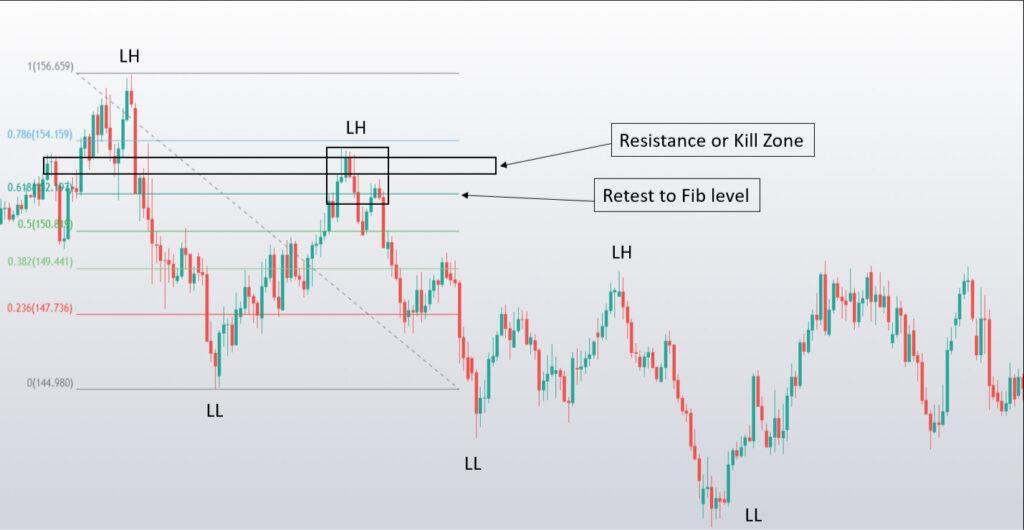
You can see the market retraced back to 0.618 (61.8%) and a beautiful fall from there, meanwhile there is also a resistance level that tested multiple times.
Note: Always Trade indicators signals wisely with proper risk management and strategy else your trading funds will always at high risk.
The information provided on this website does not constitute investment advice, financial advice, trading advice, or any other sort of advice and you should not treat any of the article’s content as such. Author, website or the company associated with them does not recommend that any cryptocurrency should be bought, sold, or held by you. Do conduct your own due diligence and consult your financial advisor before making any investment decisions.
Guruprasad Venkatesha is Co-Founder & CEO of b-cube.ai, a French-Hungarian startup making trading in cryptocurrencies easier & more profitable using AI/ML and complex mathematical models. He started his first asset management company when he was 16 years old and had a successful exit later. Then he went on to work for Morgan Stanley as an Investment analyst then he quit the job to jump into the world of Cryptocurrencies.
You can follow him on the following social media channels:
Linkedin: https://www.linkedin.com/in/guruprasadvenkatesha/
Twitter: https://twitter.com/GuruprasadVenk1
B-cube.ai Telegram community Link: https://t.me/bcubeaichat
Költs kriptóból közvetlenül a Kraken Krak Mastercarddal!
MI A TEENDŐD?- Regisztrálj a Krakenre a linkünkkel.
- Igényeld meg ingyenesen a Krak Cardot.
- Add hozzá Apple Payhez vagy Google Payhez.
- Vásárolj közvetlenül Kraken egyenlegedről akár 400+ kripto- és fiat eszközzel.
- Élvezd a 2% cashback-et a vásárlások után, havi vagy éves kártyadíj nélkül!